Seems like a strange combination! But the US Census Bureau has been posting a series of infographics called Stats for Stories that are meant to inspire data driven journalism and blogging.
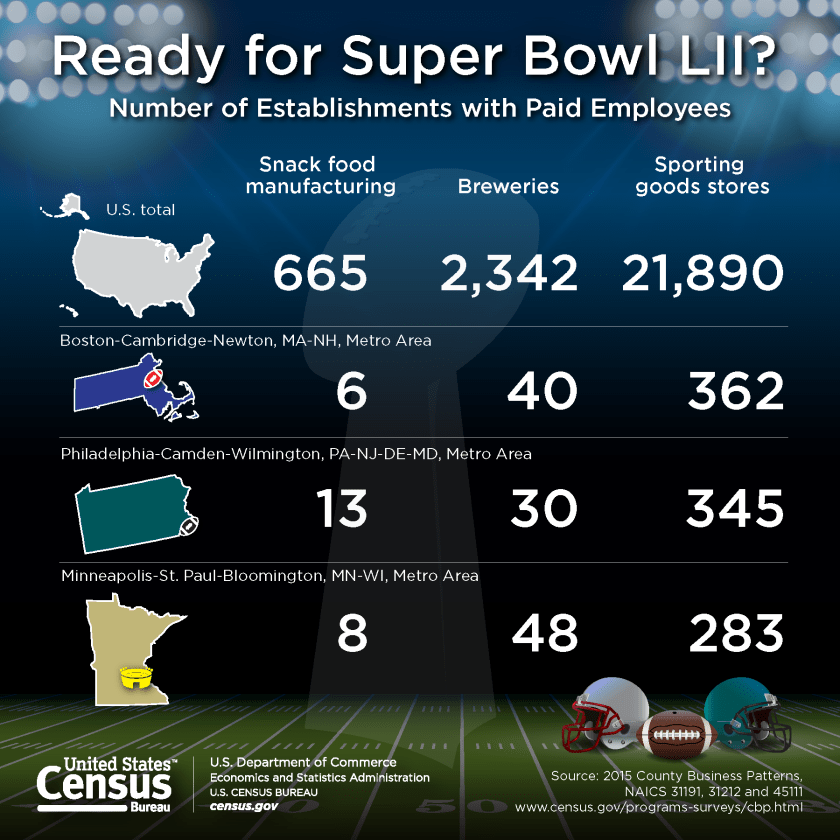
For Super Bowl 52, they produced the following infographic comparing the Philadelphia and the Boston metro areas in terms of snack food manufacturers, breweries, and sporting goods stores. I think the Pats have an edge.
Hmm. Well there are even more interesting prospects including National Inventors Day , sobering stats related to the recent Martin Luther King holiday, and a collection of stats related to Black History Month.
Which of these stories excites your passion?
